Fit for What Use?
Data doesn't need to be perfect to be useful. It needs to be fit for a specific purpose. A framework for evaluating data quality against the use case that actually matters.
”A dataset can be of very high quality for one purpose but useless for another.” Meng, 2018
Over the course of this pandemic, data has informed the most critical policy decisions: health care staffing, school safety precautions, public gatherings, the distribution of medical supplies, and many others (Galaitsi et al., 2021; Queen and Manocchio, 2022). But simply using data is not enough. The goal ought to be to use data effectively. In order to that, the quality of the data must be understood (Council of State and Territorial Epidemiologists (CSTE), 2019; Queen and Manocchio, 2022). The more important the decision, the more rigorous the standards for quality must be (Queen and Manocchio, 2022). We know that data can be sufficient for one use case but not for another. Yet the examples we have of qualitative standards1 are not particular to a use case. In order to pin down data quality we must first pin down a use case (or two). To that end, we expand on two examples from Galaitsi et al. (2021). First we’ll consider the distribution of funds to help states respond to the public health crisis. We’ll refer to this as the allocation of finite goods. For simplicity, we’ll assume that each day the federal government looks at the data and decides how to ration that day’s funds across the states for immediate distribution. Next we’ll consider the design of intervention-minded policies, such as masks mandates. We’ll suppose that the federal government is providing surge predictions, such as that from statistical or machine learning models, to state governments and in particular, California. These models will inform local policy decisions. We’ll refer to this use case as surge prediction.
A Pragmatic Approach to Usable Data
We could approach data quality from the perspective of what data should be: we can list all qualities that we want and all those shortcomings we do not want. For data producers, this is no doubt helpful to identify points of failure. For data consumers, it’s less helpful. Whatever the use case, our wants are likely very similar: high accuracy, exhaustive completeness, perfect consistency, faster than timely, and 100% valid. In short, perfect data. If these are the requirements, we are unlikely to find any suitable data. When data inevitably falls short, what are we able to do with the data–or is it nothing at all? Fortunately there is a more pragmatic approach. We can discard the sufficient conditions and instead focus on the necessary: what do we need our data to be in order to accomplish our goal? Imperfections in data, undesirable as they may be, can often be accommodated, tolerated, or mitigated under the right circumstances. In short, data does not need to be perfect to be usable. Once we acknowledge this, we can measure DQ without fear and adjust how we use the data with the knowledge of its fitness for that use.
Allocation of Finite Resources
First, let’s consider the allocation of finite resources. Because we are distributing a set of goods among the states, we know that issues with one state’s data can impact other states. So, consistency is critical. If measurement is inconsistent across states, distribution will be systematically flawed, reflecting those differences. On the other hand, it’s not critical that measurement remains the same over time: every decision is made with that day’s data about distributing that day’s goods. If measurement can be improved simultaneously across states, then it will only improve distribution. Accuracy is likewise important. Resources are being distributed and acquired according to the scale reported. If one state is over-reporting it will receive resources owed to other states. If it is under-reporting, it won’t receive the amount it’s due. The larger the disparity, the greater the impact. Minor timeliness issues can often be mitigated. A short lag in data can be easily though imperfectly accommodated by employing solutions like ”last observation carried forward” (LOCF), moving average imputation, or more sophisticated ”nowcasting” techniques. We only expect these methods to accommodate short lags. Completeness is only a concern insomuch as it impacts nowcasting efforts. We assume that resources are only allocated according to the current state of the world. Missing data on prior dates shouldn’t impact today’s decisions. Validity failures may call into question the data’s overall fitness. For instance, given our knowledge of the data production pipeline, we expect that data will have to be revised. If data has never been revised, its raises doubts over its accuracy and, as a result, our ability to nowcast.
Surge Prediction
Let’s now consider the surge prediction use case. Our goal is to predict a surge as early as possible. We assume (and have observed) that surges can happen quickly. In order to mitigate a surge, policy changes need to be implemented as soon as possible. As a result, timeliness is paramount. As we are already predicting the future, one or two days lag of data may not be dire. But even a few more day’s delay may mean it is already too late for policy changes to disrupt a surge.
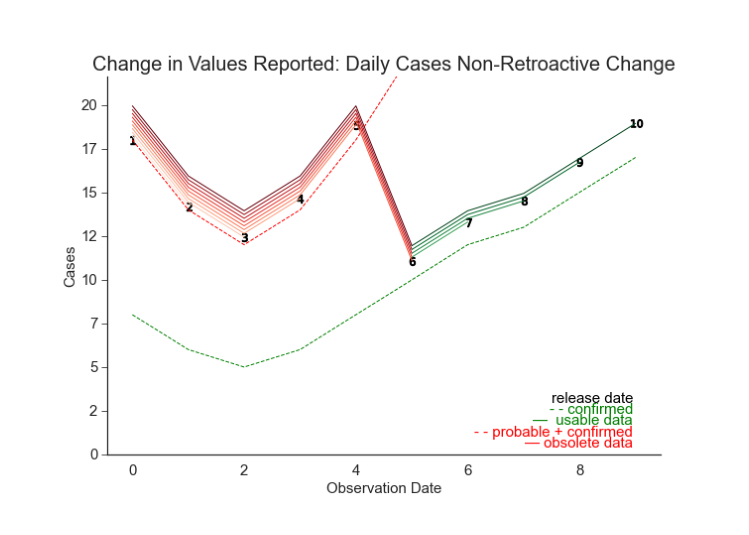
Figure 5.1. Simulation: Non-Retroactive Change, Daily Cases When a substantive non-retroactive change is introduced, earlier releases may effectively represent a distinct dataset. The policies are location-specific and so are the models. So, consistency across localities is not a primary concern. Consistency within a locality is. Sup-
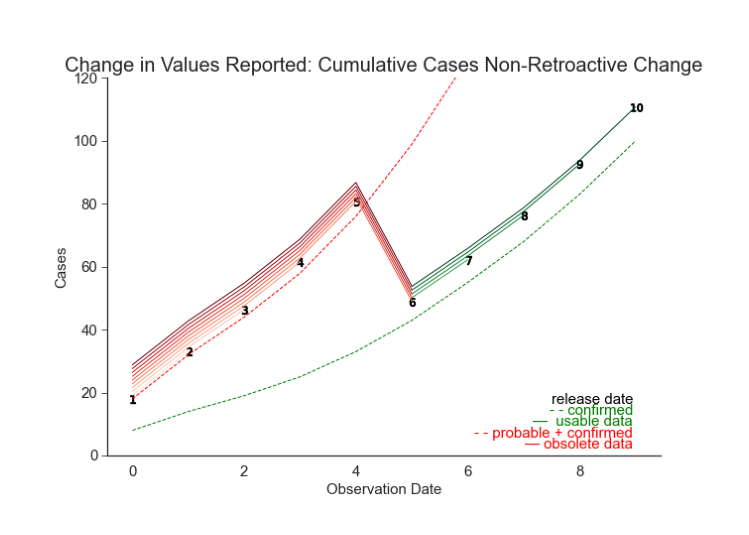
Figure 5.2. Simulation: Non-Retroactive Change, Cumulative Cases The same non-retroactive change from Figure 5.1 may appear more subtle in cumulative counts. It is always important to consider the raw and transformed data. pose a state changes their case definition. Originally they reported the sum of probable and confirmed cases. Now they have switched to reporting confirmed cases only. Because they don’t have the data to adjust previously reported dates, they’ve introduced a non-retroactive change (Figure 5.2, Figure 5.1). The data before and after the change may be reported in the same column in the same CSV file, but they record different measurements. In truth, they are simply different datasets. The earliest release we can now use is this NRC. The oldest observation we can use is the first value recorded under the new definition. Now suppose that the change was retroactively applied (see Figure 5.3). Releases after the change contain the confirmed-only cases for all prior dates. It is tempting to assume that the length of our training data has not changed. However, we know that this data can produce overly optimistic estimates of performance (McDonald et al., 2021). We only have the vintage for the date of
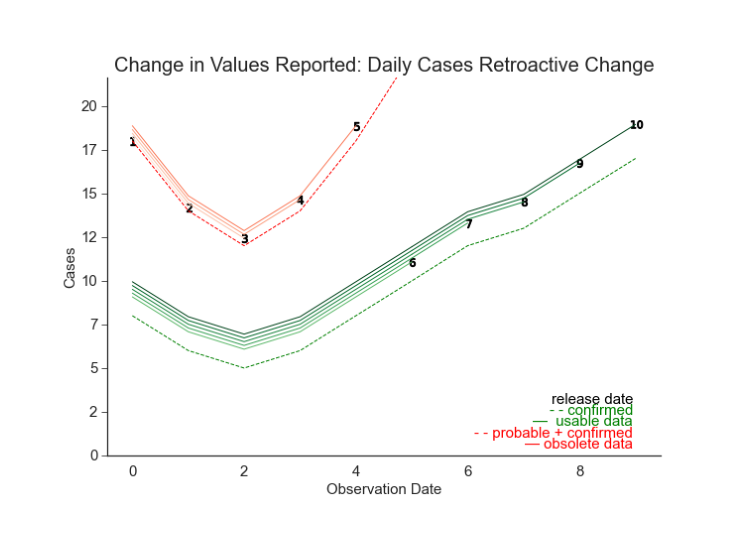
Figure 5.3. Simulation: Retroactive Change, Daily Cases When a retroactive change is introduced, subsequent releases contain updated values for previously reported observations. The length of the training history will remain the same, but the set of usable releases will begin with the retroactive change. the change going forward. Therefore when we estimate performance, we can only use the subsequent dates.2 Unlike in the finite resources case, if a locality’s data is inaccurate, the impact will be isolated. The goal is to predict changes–and not necessarily total volume. Although not ideal, systematic inaccuracy may be a tolerable flaw so long as it reflects the trends closely. This, of course, does not hold in the extreme Similarly, missingness can be managed–but not in the extreme. If a locality’s data is incomplete, there are a number of ways to address it. In addition to the imputation, some models accommodate irregularly spaced time series. The more data that is missing and the less desirable the type of missingness, the less effective the accommodations are.
For a further discussion on this topic, see Section 7.7.
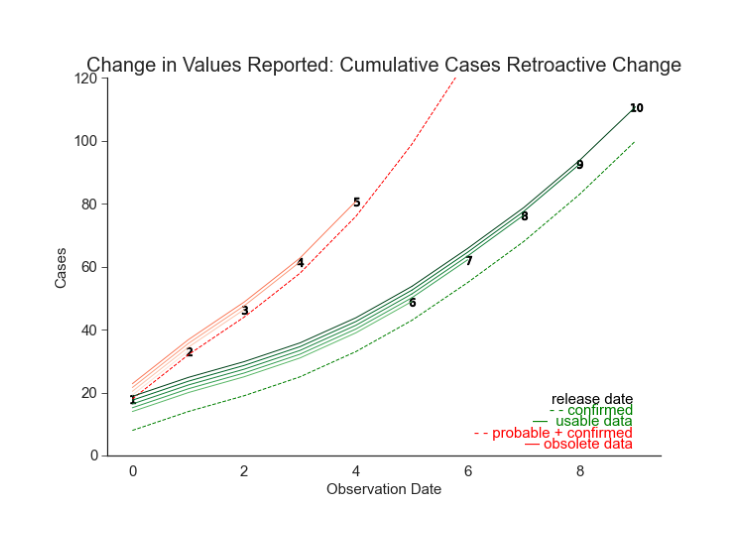
Figure 5.4. Simulation: Retroactive Change, Cumulative Cases As we saw with the NRC in Figure 5.2, a retroactive change may appear subtle in cumulative counts even though that same change appears dramatic in daily counts (Figure 5.3). If the data appears invalid, it may draw concerns for model performance. For example, if a cumulative count is decreasing, it may indicate a nonretroactive change in measurement. If the data is never restated, it may draw concerns that the data reflects the limitations of the reporting process more than it reflects the state of the public’s health.
Informing Use
We are striving to build a data quality assessment that could have informed decision makers in real time. Although we are aiming at a different goal, we may still benefit from the existing guidance on how to manage the shortcomings of our pandemic data.
For example, ”Desk research” is encouraged to assess and monitor any changes (Stoto et al., 2022). Whenever possible, only use data sets that were created by groups with similar testing, reporting, and temporal changes (Stoto et al., 2022; Badker et al., 2021). When modeling, use ”vintage” training data3 to ensure that performance estimates are not overly optimistic (McDonald et al., 2021). Both automated and manual checks on data scraping and automated ingestion are recommended (Badker et al., 2021). Cross-collaboration and crosstraining between epidemiologists and data scientists may mitigate the chances of ”garbage-in” producing ”garbage-out” (Tang et al., 2021). Finally, acknowledge and accept the limitations of this imperfect data (Galaitsi et al., 2021). The preceding advice is most useful for those conducting research after-the-fact. Our real-time constraints preclude us from pursuing most of these suggestions. There is simply not enough time each day to execute qualitative or manual research. Nor is there time to carefully interpret the qualitative results and thoughtfully fold them into the decision process. Real-time decisions demand both real-time data and a real-time assessment of the quality of that data. Furthermore, the assessment must be both understandable and actionable in realtime as well. These constraints may seem burdensome, but, as Queen and Manocchio (2022) assert, ”the importance of assessing the quality of this data cannot be overstated.”
Only use data released prior to the simulated testing date.